Charles May has described a concept for the formation of a mathematical model for orthokeratology based on the fact that Bowman's membrane does not alter its surface area in response to orthokeratologic treatment. According to May's formula, the surface area of an ellipsoidal surface with an apical radius of 7.80mm, an eccentricity of 0.50 and a chord of 12mm is 134.47 sq. mm. A spherical surface with an eccentricity of zero and the same chord and surface area as the ellipse would have a radius of curvature of 8.205mm. The differences in the radius values would account for approximately 2.00D of refractive change. However, the surface area concept has some limitations because it becomes mathematically complex to describe the changes in a toroidal surface.
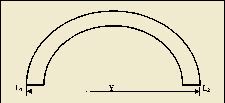
Another way to approach the same problem is to use a cross-section of the cornea and perform the calculations using the concept of Bowman's Membrane as an inextensible and incompressible line that is anchored at the limbus (Fig. 1). If we imagine that this cross-section of Bowman's membrane (or the lamellar fiber) is firmly anchored at the limbus and that the surface can change shape, then the fixed parameters are the chord length from limbus to limbus (Y) and the surface length of the fiber (L). If we assume that this cornea has a chord of 12mm, an apical radius of 7.80mm and an eccentricity of 0.50, then the surface length of the fiber is 14.474mm. Now there are two questions that need to be answered: 1) what is the relationship between the change in apical radius and eccentricity if the chord and fiber lengths are fixed and the cornea changes shape from a prolate ellipse to a sphere and then to an oblate ellipse; and 2) what effect does this have on corneal power change?
Model Relationships: Eccentricity, Radius and Power
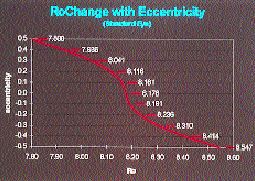
Noack wrote an iterative computer program that resolved these variables. The program calculates the fiber length of iterative eccentricities and radii in increments of 0.00001, resulting in an accuracy of 0.005 microns. The program was then expanded to allow the practitioner to enter the initial apical radius, eccentricity and chord; then the program calculates the final radius of curvature, assuming that the surface length and chord remain constant. The results of a model change are shown in Figures 2a and 2b. Figure 2a represents the change in apical radius as the cornea changes shape from a prolate ellipse with an apical radius (ro) of 7.80mm and eccentricity of 0.50 to a sphere with a radius of 8.175mm (e=0) to an oblate ellipse with a radius of 8.547mm and an eccentricity of -0.50.
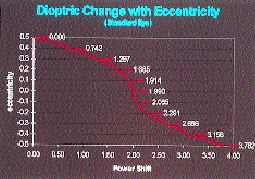
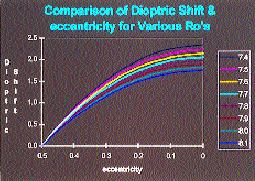
Using corneal topography in an analysis of 56 randomly chosen eyes, Mountford found a change of 0.188mm radius of curvature for each 1.00D change in apical corneal power. This change in apical corneal radius would therefore account for an approximate change of 2.00D in apical corneal power for a change from a prolate ellipse to a spherical surface. Figure 2b shows the conversion to corneal power change of the relationship between changes in apical radius and changes in eccentricity that are shown in Figure 2a. While there is a one-to-one relationship between change in apical corneal power and refractive change, the relationship between apical corneal power change and eccentricity change is nonlinear. For example, the change in eccentricity from 0.50 to 0.20 results in a refractive change of 1.685D, and the change from 0.20 to zero yields a further change of only approximately 0.30D. The total change in refraction from an eccentricity of 0.50 to zero is 1.99D. If the cornea becomes oblate, then the same nonlinear relationship works in reverse. For example, a change to a negative eccentricity of -0.30 would be required to gain a further reduction of approximately 0.75D. The total refractive change possible would be 3.78D if the cornea changed from a prolate ellipse with an eccentricity of 0.50 to an oblate with an eccentricity of -0.50.
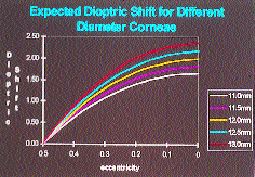
The other factors that influence the relationship between apical corneal power change and eccentricity based on this model are: chord measurement -- the greater the chord, the greater the change (Fig. 3); initial apical radius -- the steeper the initial ro, the greater the change (Fig. 4); and initial eccentricity -- the higher the eccentricity, the greater the change.
Taking It to the Limit
Previous studies have found that the average corneal eccentricity is in the region of 0.50. Kerns (1976) found that the limit of the traditional orthokeratology techniques was reached when corneal eccentricity reached zero. Other authors have proposed that the cornea becomes oblate following accelerated orthokeratology using reverse geometry lenses, based mainly on temporal K readings.
In the study listed here, we reviewed the change in apical corneal radius from the start to the completion of a course of accelerated orthokeratology using a modified Contex OK704 design on 64 randomly chosen eyes. We assumed that the completion of a course of treatment occurred when there was no further change in corneal shape or refractive change over a period of two months. We read the initial and final apical radius values directly from the EyeSys numeric plots. We measured the horizontal visible iris diameter (HVID) values using the program supplied with the instrument, but HVID is not the actual measurement of the corneal diameter. Bowman's Membrane ends abruptly at the limbus, which we assumed to be 1.00mm greater than the HVID for the purpose of this analysis.
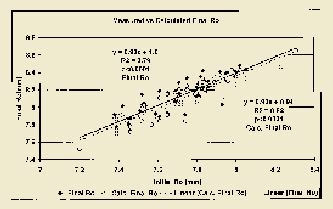
Figure 5 illustrates the relationship between the pre-and post-ortho-k apical corneal radius changes and the mathematically modeled regression relationship. The regression forms between the actual and the modeled changes are very similar, even though there is a large variation in the spread of the data for the readings. We applied a paired Students T-test to the measured and calculated apical radius values. The differences were statistically significant (t stat = 5.42, p<0.0001, df 63). The mean measured final ro was 8.13mm (s.d. 0.22mm) while the mean calculated final ro was 8.10mm (s.d. 0.22mm). When converted to change in apical corneal power, the mean measured change was 2.21D (s.d. 0.56D) and the calculated change was 2.04D (s.d. 0.51D). In percentage terms, the modeled change accounts for approximately 93 percent of the changes observed. While these results may be statistically different, they are not clinically different from each other.
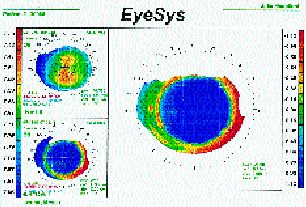
In all of the study subjects, the measured and calculated final ro value associated with an eccentricity of zero. Figure 6 shows a typical pre- and post-orthokeratology axial and tangential corneal topography plot. Note that there is a central spherical zone surrounded by a midperipheral steep zone that flattens again as the periphery is approached. Temporal K readings give the impression of an oblate surface because they measure an area in the steep midperipheral zone. The overall result is that the limit of the procedure is reached when the corneal eccentricity reaches zero.
Other Variables to Consider
The similarities between the actual and modeled readings should not be treated as being the final proof of the mathematical model; there are other factors that must be taken into account. The decision about what actually is the final apical radius depends on the practitioner's assessment of each individual case. The accuracy of the instrument readings can also be a source of discrepancy. Furthermore, the actual corneal shape is not a prolate ellipse, but a far more complex shape that tends to flatten at a faster rate than an ellipse as the limbus is approached. Finally, we must consider what effect, if any, epithelial hypoplasia (centrally) and hyperplasia (peripherally) have on the shape and refractive changes we see.
Bowman's Membrane may be a good basis on which to build a model, but it is covered by a layer of epithelium that is compressible and moveable. Greenberg and Hill (1973) have shown that epithelial thinning is associated with compression from contact lens fitting, and Coon (1984) found a decrease in central corneal thickness and an increase in peripheral corneal thickness in his ortho-k group. These changes in epithelial thickness may account for some of the refractive changes we see, but the degree of influence is not yet known. If our mathematical shape model were 100 percent accurate, then the corneal topography plots would reflect it by showing the final corneal shape to be spherical. Figure 6 shows a central spherical zone surrounded by a relatively steeper mid-peripheral zone, and the changes in epithelial thickness may play an important part in causing this appearance.
Our model for the corneal shape changes associated with orthokeratology is based on the anatomical restrictions placed on the cornea by the inelasticity of both Bowman's membrane and corneal lamellar collagen. The actual design or fit of the contact lens is purely the initiator of the corneal shape changes. The relationship between the design of the lens and the shape changes it induces is yet to be determined, although Mountford has shown that there is no correlation between the flatness of fit and the change in apical corneal power.
The interactions of contact lens design, corneal rheology and corneal anatomy cause the effects that we call orthokeratology. However, we are still a long way from understanding the complexity of these interactions.
References are available upon request to the editors at Contact Lens Spectrum magazine. To receive references via fax, call (800) 239-4684 and request document #37. (Be sure to have a fax number ready.)
Ortho-k Lens Design and
|
John Mountford is in private practice specializing in contact lenses in Brisbane, Australia, and has authored numerous papers on orthokeratology.
Don Noack is the managing director of Capricornia Contact Lenses and is in private practice in Brisbane, Australia. He also serves as a computer consultant on lens design and process engineering for various contact lens laboratories.
Both authors are visiting lecturers on contact lenses to the Department of Optometry, Queensland University of Technology.


