A Practical Guide to the Interpretation of Corneal Topography
BY CYNTHIA ROBERTS, PH.D.
MARCH 1998
Different topographic displays offer different perspectives on the cornea, but only by knowing how to interpret them can you maximize the utility of this device.
Since its introduction, corneal topography has become a widely accepted diagnostic tool. Despite the high visibility of corneal topography in the literature and at scientific meetings, confusion is still common regarding appropriate interpretation of the maps. Inconsistent and sometimes inappropriate terminology used within the corneal topography industry and within the scientific literature is often the cause. To help you wade through the maze of terminology and types of topographic maps available, this article offers a non-mathematical description of some important concepts in corneal topography, along with some practical tips for map interpretation.
Meet the Maps
It's crucial to realize that all of the displays are mathematically related to each other; each one can be derived from another. Therefore, no one map offers the best representation of the cornea because each provides the clinician with different information. The clinical application of the topographic data is what determines the best choice of map or combination of maps.
There are four types of topographic displays classified into one of two categories: corneal shape and corneal function. Three displays are classified as corneal shape maps and one is classified as a corneal function map. Two of the three corneal shape maps are related to curvature and one is related to surface height. The one function map is the refractive power map. Contrary to the widely held misconception that there are multiple power displays, only the refractive power map provides information about light refraction and focussing power over much of the corneal surface area.
Curvature Maps (Corneal Shape)
Curvature indicates how much a two-dimensional curve bends with distance. In common topographic color displays, curvature is multiplied by a constant and is represented in units of diopters. However, despite the units of power, curvature does not represent function or focussing ability and cannot be compared directly to refraction. These diopters are not equivalent.
One of the two topographic displays related to curvature, which we'll call ROC-D, is based on the radius of curvature at a corneal surface point in a plane defined by a corneal meridian. ROC-D can be considered "scaled curvature" since it is the reciprocal of the radius of curvature, multiplied by a constant. The other display, which we'll call AD-D, is based on the axial distance, which is the distance from a corneal surface point to the reference axis along the normal to the curve in a plane defined by a corneal meridian (Fig. 1). AD-D can be considered a "running average" of the scaled curvature value (ROC-D) from the center of the map out. For example, if the center of the ROC-D map is 45 diopters, and 2.0mm from the center along the meridian at 45 degrees the value is 41 diopters, then the value of the AD-D map 2.0mm from the center along the 45-degree meridian will be the average of all the values between and including 45 diopters and 41 diopters on the ROC-D map. Any extreme values present on the ROC-D map, such as a cone on a keratoconus patient or the transition zone on a refractive surgery patient, will be averaged out on the AD-D map.

FIG. 1: Illustration of the difference between radius of
curvature (ROC) and axial distance (AD). AD1 and AD2 are the endpoints of the axial
distance from a surface point in a relatively flat zone and relatively steep zone,
respectively. ROC1 and ROC2 are the endpoints of the radius of curvature for the same
surface points. AD is less than ROC in relatively flat areas and greater than ROC in
relatively steep areas.
What are the practical differences and similarities between ROC-D and AD-D, and how do these features affect their application in a clinical practice? Both formulas are qualitatively similar but quantitatively different. Since the AD-D, or axial formula, is a running average, it can be considered a smoothed representation with less noise, less variation and very importantly, less detail. All of the largest and smallest values are averaged out, so the range of values present is much more limited than in the corresponding ROC-D map. However, because they are qualitatively similar, AD-D will produce the same pattern as ROC-D, only larger since it is smoothed or averaged from the center of the pattern out. For example, a normal cornea with a prolate ellipsoid shape will be steepest in the center and flatten toward the periphery in both maps, though the ROC-D map will show greater flattening. In an astigmatic cornea, both formulas will show a bow tie pattern along the same meridian, but the AD-D bow tie will be bigger and won't show as much peripheral flattening (Fig. 2). The steep and flat meridians of the two maps should be identical. A keratoconus patient will show a large, diffuse area of steepening on an AD-D map due to the averaging, and a smaller, confined cone on the ROC-D map due to the local detail. The steepest part of the cone will be more central in the ROC-D map and pushed more peripherally in the averaged AD-D map. The apex of the cone will be steeper in the ROC-D map since the extreme values are averaged out of the AD-D map (Fig 3).

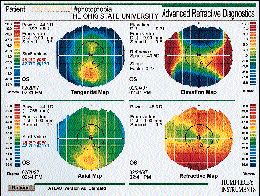
FIG. 2: Four-map display of an astigmatic individual demonstrating that
both the ROC-D (labeled tangential - upper left) and the AD-D (labeled axial - lower left)
displays show the steep meridian at approximately 80š. Due to the averaging nature of
the algorithm, the bow tie pattern is physically larger in the axial display and doesn't
show as much peripheral flattening. The elevation map (upper right) also shows the steep
meridian at 80š which is represented by the blue areas, lower than the best-fit
sphere. The flat meridian is above the sphere. The refractive power map (lower right) once
again demonstrates the steep meridian at approximately 80š. Note the differences
between the refractive power map and the axial map.

FIG. 3: Four-map display of a keratoconus patient demonstrating a smaller
confined steep zone on the ROC-D map (labeled tangential - upper left), and a diffuse
steepening on the AD-D map (labeled axial - lower left). Of the two maps, both the
steepest and flattest values are on the ROC-D map. The steep cone apex is shown in reds,
sitting on top of the best-fit sphere in the elevation map (upper right). Note the
differences between the refractive power map and the axial map.
In what setting should each map be used? Clinical applications where local detail and accurate curvature representation are necessary, such as in the post-refractive surgery patient, require the ROC-D map. In this case, the AD-D map would average out the transition zone between ablated and non-ablated regions of the cornea, which is important for determining surgical centration, as well as the variation in the ablation pattern, which is important for understanding visual outcome. Clinical applications where a more global or average representation of the corneal curvature is necessary require the AD-D map. The AD-D map has proven to be more useful in fitting contact lenses where the goal is not to match the local detail of the corneal surface, but to match the spherical back curve of the lens to the average curvature of the cornea. Table 1 summarizes the similarities and differences between the two maps. Note that both the ROC-D map and the AD-D map are referred to by many different names.
|
Elevation Maps (Corneal Shape)
The height of the cornea is another descriptor of its shape. Height differs from curvature in that it must be measured relative to an established reference. There are many possible references for the cornea, but the two most basic are a fixed plane and a sphere. Height that's relative to a plane is called absolute height, and height that's relative to a sphere is called elevation. Because the cornea has an underlying curvature, using a plane as a reference doesn't allow the subtle surface features which affect vision to be appreciated. The features are still present in the data, but they are buried in the overall curvature, which is a much more prominent feature. A sphere reference, on the other hand, highlights the surface features and is therefore the more useful reference for interpreting topographic information. Keep in mind that changing the reference does not alter the actual data, but merely the manner in which it is displayed.
Should the raw data be fit at the apex of the cornea, at the periphery or somewhere in between? For most applications, a best-fit sphere provides a useful, repeatable reference. This is a mathematical fit to all the data using a least-squares approach that minimizes the sum of the squares of the differences between the sphere and the cornea. The best-fit sphere is therefore a measure of the overall curvature of the cornea, and the elevations are displayed both above and below the sphere. Areas below the sphere are generally assigned negative values and cooler colors such as blues and purples; areas above the sphere are assigned positive values and hotter colors such as oranges and reds (Fig. 4). Figures 2 and 3 also provide examples of elevation maps.

FIG. 4: The absolute height map (labeled raw - left) and corresponding
elevation map from a severe keratoconus patient. Note the advanced cone is not visible on
the absolute height map because the overall curvature of the cornea is still a more
prominent feature. The cone is visible on the elevation map (right) as the red area
located above the best-fit sphere.
Interpreting elevation maps requires the user to disregard the rules for interpreting color maps based on curvature. On an elevation map, red does not necessarily mean high curvature and blue does not always correspond to low curvature. Red, for example, means that the height is above the sphere but can be steep or flat, depending on the location of the red zone and the morphology of the map. If the red, or high, zone is near the center of the map and is surrounded by lower zones, then the red zone is more curved than the sphere (Fig. 5). However, if the high zone gradually increases from the center to the periphery, then it corresponds to a flatter area, such as the flat meridian in astigmatism. If the blue zone is located in the center of the map and is surrounded by higher zones, then it is flatter than the sphere. However, if the blue zone gradually increases (increasing negative values) from the center to the periphery, then it corresponds to a steep area such as the steep meridian in astigmatism. Figure 6 shows the elevation map of an astigmatic patient. It is crucial to understand that negative values, or blue areas, are simply lower than the sphere and do not imply a depression or concavity (Fig 7).

FIG. 5: Four-map display of a keratoconus patient demonstrating the high,
steep cone on the elevation map ( upper right). This corresponds to a small, confined
steep zone on the ROC-D map (labeled tangential - upper left), and a diffuse steepening on
the AD-D map (labeled axial - lower left). The refractive power map is labeled optical
power (lower right).

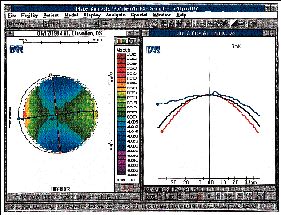
FIG. 6: Topography of an astigmat with the elevation on the left and a
profile map on the right. The profile map demonstrates that the steep meridian represented
by the red line sits below the best-fit sphere shown in black. The flat meridian
represented by the blue line on the profile map sits above the sphere. On the elevation
map, the steep meridian overlays the blue zones below the sphere and the flat meridian
overlays the high zones.

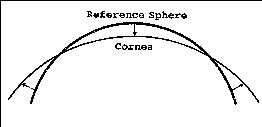
FIG. 7: Graphic illustration that areas of the cornea below the best-fit
sphere are not concave. Here the central low areas are flatter than the best-fit sphere.
An analogy for understanding elevation topography is the fluorescein pattern in contact lens fitting. Fluorescein patterns are the result of the difference in height between the corneal surface and spherical back surface of the contact lens. The high red areas on the elevation map will be closest to the lens displacing fluorescein, and the low blue areas will allow fluorescein to pool between the lens and cornea. Therefore, in an astigmatic patient, the flat meridian will displace fluorescein since it is high, and the steep meridian will pool fluorescein since it is low. In a keratoconus patient, the cone will displace fluorescein since it is high, and the surrounding low areas will allow fluorescein to pool.
Understanding the relative nature of the height maps when analyzing temporal trends in elevation is crucial. For an accurate comparison, the coordinate systems in which the corneas were measured must be overlapped. This means that small differences in surface height from one time point to another probably cannot be detected, even though small differences in height on a single map are easy to detect. For example, a device with one micron resolution in height can detect very small corneal surface features, but if two independent maps from this device are compared, a difference of one micron in height can be detected only if the coordinate systems from each time point are overlapped with less than one micron accuracy, which is unlikely. With large differences in elevation, such as in a laser refractive surgery patient, a difference map can be approximated by overlapping points on the corneal surface nearest to the periphery where it is assumed the surface has not been altered. Therefore, ablation profiles can probably be evaluated fairly well, but it is unlikely that exact ablation depths can be determined within accuracy of one micron or even ten microns. On the other hand, evaluating small differences in elevation from one time point to another requires a fixed reference, which is not available in current topographic systems. For example, the phenomenon of bulging, or vaulting of the entire cornea forward by a small amount, would be extremely difficult to evaluate without a reference fixed in space.
How valuable is elevation data, considering the relative nature of the measurement and the caution necessary in interpretation? Should you bother learning how to interpret elevation maps if you are familiar and comfortable with curvature? Elevation is important for certain applications, and it may provide some answers that curvature can't. For example, height is the determining factor in contact lens fitting as illustrated by the use of fluorescein patterns. In addition, in cases of post-penetrating keratoplasty, irregular astigmatism or other bizarre corneal shapes, curvature maps are often extremely difficult to interpret. Another application is laser refractive surgery, where only height data can provide information about ablation profiles.
Power Maps (Corneal Function)
Power is a term that refers to function or the ability to focus light, but the term is often used in corneal topography to describe shape. It can be very confusing to the user to see a topographic map that doesn't represent refractive power but is labeled in diopters -- units of power. Keep in mind that many shape maps are actually called power maps on many commercial devices, so you must be well informed to understand what information is being presented.
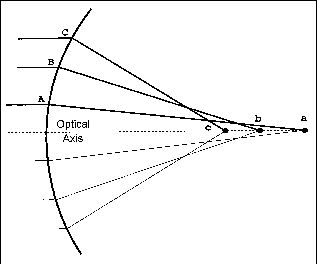
A number of manufacturers have introduced refractive power maps to be used in conjunction with other displays. Power maps are calculated by modeling the cornea as a single refracting surface and analyzing the path of incoming parallel rays. This provides an indication of where a ray of light that refracts at a corneal surface point crosses the optical axis of the cornea (Fig. 8). The shorter the focal distance, the greater the refractive power. It has been suggested that the axial map gives an approximation of the refractive power map, but this is quite misleading since the axial map applies only to a very small region in the center of the cornea. In fact, for a normal cornea, the AD-D will show decreasing values from the center to the periphery at the same time that the refractive power map will show increasing values from the center to the periphery. Therefore, consider the axial map and the refractive power map to represent different kinds of information -- shape and function, respectively.

FIG. 8: Graphic illustration of the concept underlying the refractive power
map. Incoming parallel rays strike the cornea and are refracted. Ray C has the greatest
refractive power since it crosses the optical axis at the shortest focal distance, the
endpoint of which is denoted by c. This surface has increasing refractive power from the
center to the periphery, demonstrating spherical aberration.
You Need All Maps to Complete the Picture
There is no best map in the evaluation of corneal topography. Different clinical applications lend themselves to different map types. A thorough evaluation depends on knowledge of all corneal topographic displays: curvature (ROC-D and AD-D), height and power. All quantities are mathematically related and when examined together, present a more complete picture of the cornea. All devices, independent of their technology, are capable of generating all four map types. However, not all manufacturers choose to present these displays to the user.
A national committee has been formed to address the need for standardization in corneal topography. There is participation from both industry and academia in the development of an ANSI standard, and a great deal of time and energy have been invested by the participants. We must await the conclusion of this ongoing effort before the terminology and labeling of topographic maps becomes less confusing and inconsistent.
The author wishes to thank Mr. Songsdhit Chongsiriwatana for assistance in generating figures.
References are available upon request to the editors at Contact Lens Spectrum. To receive references via fax, call (800) 239-4684 and request document #34. (Be sure to have a fax number ready.)
Dr. Roberts is an associate professor of biomedical engineering, ophthalmology and surgery at The Ohio State University, Columbus.


