Corneal topography, originally named photokeratoscopy or videokeratography, is not the newest kid on the block. Commercially available, computer-supported systems were introduced about 30 years ago. Its use has been steadily increasing globally over time and was helped by the re-introduction of orthokeratology, which requires corneal topography to fit.1 It is important to consider that the cornea is responsible for about 70% of the refractive power of the ocular system.
Many (specialty) eyecare practitioners (ECPs) have access to a topography system to map the ocular surface. This makes sense; our primary responsibility as contact lens practitioners is to align the lens that we are fitting with the shape of the eye as optimally as possible, whether it be a corneal GP lens, a soft lens, or a scleral lens. To do so, we need information about that shape. This is where topographers come in. However, do we take full advantage of the systems that we are using? Are we making the most of all of the information that topography systems provide?
This article revisits and revamps this topic to upgrade our contact lens practices to the next level. We will focus on Placido disc systems, named after a Portuguese “oculist” and “Lord of the Rings” Antonio Placido who, in 1880, first described a disc with rings reflected from the corneal surface that he could use to subjectively observe the regularity, and the irregularity, of the ocular surface.2 This was the very first method of differentiating a “normal eye” from an irregular cornea. Topographers based on the Placido disc still represent the most popular topography systems in contact lens practice. This system is, by definition, reflection-based, which also means that “the mirror” needs to be in good shape.
Other Corneal Measurement Systems For the sake of completeness of this overview, Scheimpflug systems, though less commonly used in contact lens practice, can be also used to image the cornea. This technology works by taking images of several optical sections of the cornea (as we do with a slit lamp). These systems are very good at mapping the front and back surfaces of the cornea and thus can create a thickness map as well. Mapping the back surface of the cornea can be beneficial for early detection of keratoconus. Therefore, the thickness maps are ideal for evaluating the cornea prior to corneal cross-linking or refractive surgery. Despite advances in technology, there is no established topography index for the diagnosis of keratoconus, but it has been reported that using “Kmax” (the maximum keratometry reading in the topography map) would identify changes earlier compared to the thinnest pachymetry.3 Combining the two would likely be most preferred.
Optical coherence tomography (OCT) systems can, in theory, be used for similar reasons, but they are not as common in practice to date as corneal topographers are. Profilometry systems, which are projection systems that use fluorescein to create a “screen” on the ocular surface, have the added benefit that they can also image scleral shape.
TOP 10 TIPS FOR OPTIMAL CORNEAL TOPOGRAPHY IMAGING
First and foremost, it is important to revisit the procedure of capturing a good topography map. To more frequently and directly use corneal topography data to design different types of contact lenses, we must have the best and most reliable eye shape values possible. This is especially true for orthokeratology, which is essentially 100% based on topography input. Scleral lenses—and even sometimes soft lenses—are following in these footsteps. Eyecare practitioners can use topography data to design the lenses themselves, or they can upload the data to the laboratories to do the magic for them.
The following top 10 list of tips for an optimal topography output with Placido disc systems is derived from the international literature, from experience with corneal topography, and from input provided by laboratories and manufacturers who work with—and analyze—topography data on a daily basis.4
- Calibrate the instrument. To ensure that the topographer, the design software, and the lathes that produce specialty contact lenses are aligned and speaking the same language, it is essential to make sure that they have “synchronized their watches.” To get everything in sync, the topographer needs to be calibrated. This is typically accomplished by placing a model—often made of steel and having known, exact parameters—in front of the instrument and performing a scan as directed. This will improve the accuracy of the instrument.
How often the calibration step needs to be repeated depends on the instrument itself, how frequently the instrument is used, and whether the instrument is often moved. A topographer that is placed on a sliding bench with, for example, a slit lamp is more likely to receive “shocks” from being moved, and this requires more frequent calibration. Always lock the instrument onto its base with the turning wheel/screw when not in use. Many manufacturers advise calibrating a corneal topographer once per week to once per month, depending on the variables mentioned. - Measure in a dark environment. It was already mentioned that Placido disc systems use the reflecting light coming off of the cornea. However, other light sources also use the cornea as a mirror, and these external lights can disturb the image. Darkening a room can help to prevent this. Consider the monitor of the topographer itself or other monitors in the room, and avoid bright light sources from the ceiling. An outside light source (a window) may also cause significant disturbances to the Placido image.
- Stimulate natural eye blinking. If the tear film is not stable, “dry spots” can develop on the ocular surface. Some topographers use this to their advantage in measuring the tear breakup time for tear film assessment. However, for the quality of the topography image, these dry spots are detrimental. For that reason, it is also important to take repeated measurements (see tip 5). Many subjects forget to blink when they are behind the instrument. This, however, promotes tear evaporation and tear breakup. So, remind patients—repeatedly—to keep blinking in a normal fashion until the instrument is ready and then to open their eyes as wide as possible during the topography capture (see also tip 7).
- Use eyedrops if necessary. If the tear film is very unstable, an artificial teardrop can be used to “smooth” the surface. As previously stated, a good reflection of the ocular surface is of utmost importance. If the reflection is not good, the Placido rings will start to deform and to overlap. The eyedrop should not be too viscous unless the eye has pathological dry eye (with no reflection at all). Otherwise, the viscous drop will smooth out too many irregularities.
- Take multiple images. When it comes to producing sophisticated contact lenses based on topography, a common saying is “garbage in equals garbage out.” Therefore, assessment of the image is important. Apart from the aforementioned tear breakup issues, tiny particles can float around on the ocular surface (think mucous strands or an eyelash) that can cause artifacts or artificial elevations. Taking several images and doing a “sanity check” by looking at the original Placido ring image can help prevent analysis and diagnosis errors. Many topographers also can automatically evaluate the quality of the image and thus can be of assistance in this.
- Search for symmetry. Reading a topography map is not as easy as it may appear at first glance. The essence of finding normal eyes with corneal topography is to always look for symmetry. In a standard eye, we typically see a different shape or pattern along one meridian, and the two primary meridians are 90º apart (perpendicular to each other). This is simply with-the-rule astigmatism (if the flattest meridian is horizontal), against-the-rule astigmatism, or oblique astigmatism. But, the pattern is symmetrical.
It becomes slightly more challenging if there is a difference in shape within one meridian; for example, the dioptric power in the upper half of the vertical meridian has a difference of more than 1.50D compared to the lower half. Also, if the shape change is not a straight line of 180º but has an angle of around 20º or more, this would be regarded as asymmetry and possibly as an indication of keratoconus. In these cases, the cornea is described as “non-rotationally symmetrical.” Even if the right and the left eyes have a difference of larger than 1.00D, this is considered “asymmetrical” and could be an additional sign of keratoconus (see tip 9 pertaining to indices as well). - Improve peripheral measurements. For almost all types of lenses, it is necessary to obtain an image over as large a surface of the eye as possible. Keratometry typically measures the central 3mm of the cornea, but the standard cornea (horizontal visible iris diameter) is almost 12mm in size.5,6 This is why topography can be such a fantastic tool. However, toward the periphery, Placido disc-based systems typically become less complete and more inaccurate.
To combat this, first ask subjects to open their eyes as wide as possible in a natural way during a measurement (but ask them to keep blinking in between measurements as in tip 3). Because of shadows cast by the nose or by eyebrows/eyelashes—which typically happens more with instruments that have larger cone sizes—more noise and failure of reflection can occur. In the first case (a shadow of the nose), it can be helpful to have patients turn their face slightly “inward” (e.g., turn the head left slightly when measuring the right eye). For shadows of the eyelashes, the patient or the practitioner can retract the eyelid slightly; however, make sure to press only on the orbit rim and not on the globe, as pressing on the globe can affect ocular surface shape. Sometimes it helps to occlude the eye that is not being measured to improve fixation and to prevent shadows. Interference with the tear prism on the (mostly lower) eyelid can also cause distorted images in the periphery, leading to ring-jam, in which the Placido rings start to overlap.
Some instruments allow practitioners to take several different measurements (top, left, right, below, and central), of which a composite map can be created with the internal software. This is slightly more labor-intensive, and the stitching of the images is complex and prone to assumptions in the calculation process. However, these disadvantages may be outweighed by the view of a full limbus-to-limbus image as opposed to only a small central portion of the cornea. - Use different scales. A corneal topographer is a very powerful tool if used to its full potential. It is important to practice with the different settings to determine what is most optimal. Often, more than one scale or setting is needed to get the most out of the image. One of the more important tools is the absolute scale versus the relative (or normalized) scale. In short, the first one is most suitable to compare measurements between each other (to compare right to left eyes, to compare with previous measurements, and to benchmark eyes), because the scale is always the same. The second one uses all of the colors that the instrument has available to map the particular eye that you are measuring. Hence, it provides more details, but the scale is unique for that individual eye only.
A second crucial setting is the axial (also named sagittal) versus the tangential map. These maps can and should be used in conjunction with each other. The axial scale uses the optical axis as a point of reference to all points measured on the ocular surface. It can be used to image power changes on the ocular surface (which can be very useful in the case of orthokeratology, for example). The tangential map, in a nutshell, provides more detail compared to the axial map, as it is not fixed to the optical axis (the starting point of the radius of a given point could be located anywhere). In essence, this provides a more realistic view of what the cornea looks like as well as a better representation of true shape, which is important for fitting contact lenses. This map can also be used to evaluate the centration of an overnight orthokeratology lens.7 - Use indices to assist in data assessment. To help practitioners digest all of the information, topographers have built-in indices that combine several types of information. For example, the I-S index compares the inferior half versus the superior half of the cornea. Another common index is the SAI (Surface Asymmetry Index), or some variation of this depending on the instrument used. This index assesses the difference in dioptric value between opposite semi-meridians to look for asymmetry. The Surface Regularity Index (SRI) compares the power at each point within the central zone of about 4.5mm to the points immediately surrounding that zone, which is a good indicator of expected visual acuity. Many of these indices help us judge symmetry (see tip 6), and it certainly is worthwhile to invest some time into evaluating the meaning of the indices that your topography system provides.
- Use elevation maps. One of the most important and perhaps undervalued topography maps is the elevation map. Elevation maps represent the height above or below a fixed reference point. Placido disc systems use the tangential data to generate height maps. Other systems (Scheimpflug, OCT, profilometry) can measure height directly. However, an absolute height map would not tell us much other than that the cornea is a sphere, which is not a real surprise. But it gets really interesting when relative height maps, or elevation maps, are generated. These maps provide values relative to a best-fit sphere (or ellipse) and identify which areas are higher or lower compared to this best-fit reference. This way, in one glance, we can obtain a good idea about the true eye shape. For example, it indicates exactly where the fluorescein pattern would show pooling or bearing in a corneal GP lens fitting. This map can also help in differentiating keratoconus from pellucid marginal degeneration. It is an invaluable tool in contact lens practice.
HOW TO REVIEW A TOPOGRAPHY MAP
After capturing a high-quality topography image, it is time to analyze it. When reviewing a topography map, the first observation might be the position of the corneal apex. Using the ubiquitous axial or tangential display, the apex or steepest portion of the eye is normally close to the geometric center of the cornea. Figure 1 shows numerous regular or normal eye shapes. Observe how the steepest contours of the cornea are essentially apical. This may be why conventional contact lenses are relatively easy to fit on healthy, normal eyes that do not have a history of disease, surgery, or trauma; the apex of the contact lens lines up with the peak or apex of the cornea.
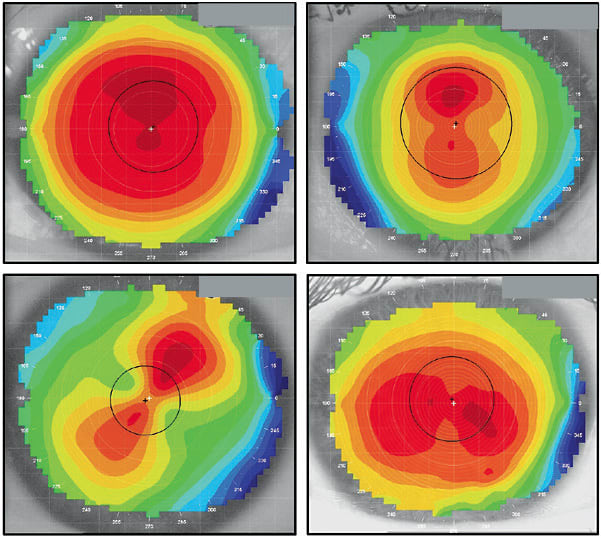
What separates normal from abnormal eyes is the degree of asymmetry. The corneas in Figure 1 show symmetrical surfaces, in which there are defined flat and steep meridians that are 90º perpendicular to each other and opposing hemispheres that are primarily mirror images. In other words, one side of the flat meridian is similar to the other side. The same can be said of the steep meridian, in which the opposite hemispheres are a close match.
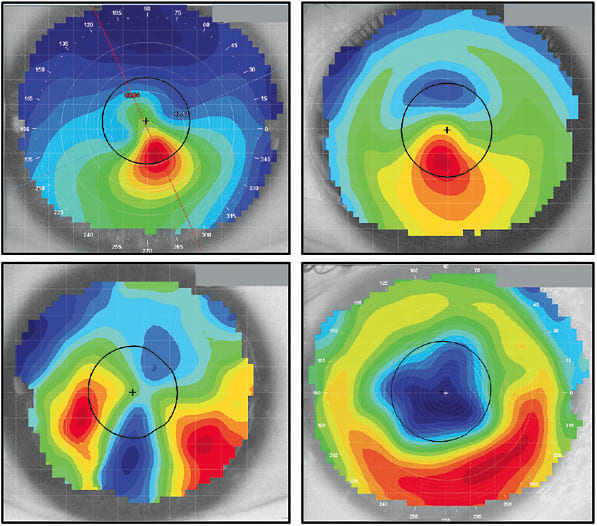
In contrast, irregular corneas may demonstrate a lack of correlation with any or all of the above considerations. Figure 2 displays numerous irregular corneas including a keratoconic eye, a keratoconic eye with a corneal ring implant, a post-graft case, and an eye following radial keratotomy surgery. In each topography, the steepest contours are not centered on the corneal apex, and in every case, opposing hemispheres are not mirrors of each other. An axial display is the best topography map to assess corneal power and its influence on visual acuity.8 In each of these irregular corneas, the distribution of power within the pupil is asymmetric and would reduce the quality of vision achievable with sphero-cylindrical refraction.7,9,10 As irregularity increases, specialty contact lenses are likely required to provide the best possible visual acuity.
It has been reported that only about 50% of eyes have symmetrical topography patterns.11 So, how do we distinguish between a healthy eye that has a displaced apex and a keratoconic cornea that has a similarly decentered peak of curvature? When reviewing Figure 3, are these normal corneas or do they appear diseased? Which analysis options can we employ to characterize these eyes and the thresholds of normal versus suspect of disease?
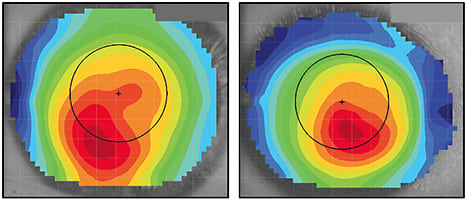
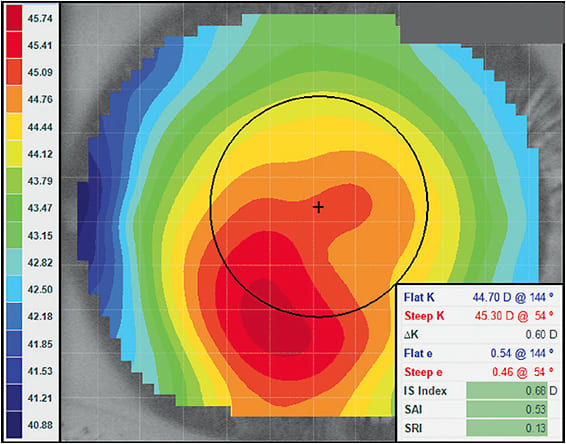
One of the simplest and most efficient ways to differentiate between regular versus irregular corneas is to review the scale range of power on the topography. Set your topographer to the “normalized” or “relative” scale and select an “axial” analysis. The power distribution across the cornea should be displayed on the color-coded scale associated with the topography. Normal corneas typically exhibit < 10.00D of power distribution across the topography.9,12 Figure 4 (the left cornea of Figure 3) shows a flattest radius of 40.88D and a steepest radius of 45.74D, resulting in a calculated scale range of 4.86D. In terms of power distribution, this cornea would be considered normal.
Keratometry or K reading may not be the most useful tool to differentiate normal from diseased eyes. As an example, pellucid marginal degeneration eyes can often have K readings of < 40.00D.13 Keratoconic corneas can exhibit K readings of > 45.00D.14 However, other corneal thinning disorders can present with radii in the normal cornea range of 40.00D to 45.00D. Additionally, healthy eyes can manifest K readings that are flatter or steeper than this range.15
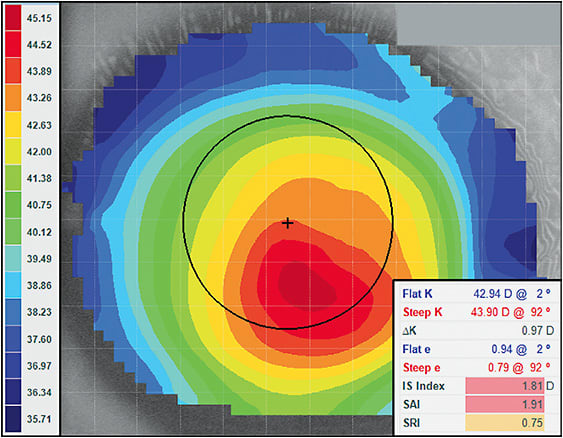
Virtually every corneal topographer employs disease detection analysis.9,16,17 However, each instrument may use a slightly different term or irregularity threshold. Practitioners should learn how to interpret the disease detection analysis in their specific topography software. In Figure 4, the three principle disease detection indices are all highlighted in green by this instrument’s software. When the analysis indicates that a cornea falls within a normal range, the measured values light up in green. Indices highlighted in yellow would suggest a suspect case, while red would indicate an eye over the threshold of irregularity. Although the color distribution in Figure 4 would suggest a keratoconic cornea, the scale range and disease detection indices would indicate that, topographically, this is a normal eye. This cornea is a good example of a displaced corneal apex and would not be considered an irregular cornea.
In Figure 5 (the right cornea of Figure 3), would we diagnose this eye as regular or irregular? Starting with the scale range, the flattest curvature is 35.71D, while the steepest radii is 45.15D. This differential of 9.44D is very close to the 10.00D threshold of an abnormal eye. Additionally, two of the three disease detection indices are highlighted in red, indicating an irregular cornea. The third is highlighted in yellow, which is suspect of irregularity. In this case, numerous indices are suggesting that this is an abnormal cornea. The remaining indicators would say that the eye is highly suspect. Coupled with the slit lamp signs and visual acuity, a comprehensive diagnosis can be made; however, topographically, this is an irregular eye shape.
In specialty contact lens fitting of irregular eyes, it is helpful to understand whether the cornea is prolate or oblate.18 The prolate eye is steepest at the apex and flatter toward the periphery. This describes most normal, non-surgically altered eyes, which are well suited to standard geometry lenses in which the back surface is also steepest in the center and flatter toward the periphery. However, in an oblate eye, the cornea is flatter in the center and steeper in the periphery. A patient who has undergone corneal refractive surgery for myopia is likely to have mildly or significantly oblate corneal topography depending on the magnitude of the prescription change. Pellucid marginal degeneration can sometimes present as an oblate shape, while approximately one-third of corneal transplant patients have a resulting oblate shape.19 Standard lenses often perform poorly on these eyes, as their regular geometry does not align well with reverse geometry eye shapes.
Corneal topographers offer multiple analysis options to define prolate versus oblate eye shapes.20 Most topographers specify the rate of corneal shape change from apex to periphery using “eccentricity.” The higher the eccentricity, or e-value, the higher the rate of corneal flattening from the apex to the periphery. Conversely, the lower the eccentricity, the lower the rate of curvature change from the center to the periphery. Unfortunately, eccentricity can describe only prolate eye shapes. Topography users must use different values to define an oblate eye and to determine whether a reverse geometry contact lens may be required.
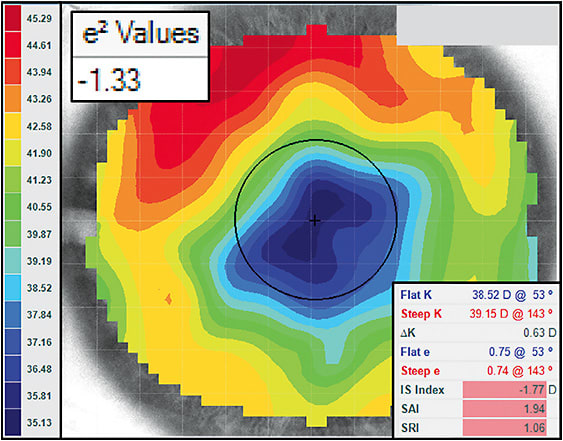
As a brief explanation, a prolate eye has a positive e2 value, with 0.0 being a sphere. An oblate eye shape would have a negative e2 value; but mathematically, e-values can only define shapes larger than zero. We can overcome this by using what has been called the p-value, which is derived directly from the e-value: p = 1 – e2. So, when using p-value, an oblate shape has a value > 1.0, while a prolate shape has a value < 1.0, and 1.0 represents a spherical surface. Another approach to describe the asphericity of the cornea is to use Q, which is derived by the equation Q = p – 1. When using Q-values, oblate shapes have a value > 0, prolate eyes have negative values, and 0.0 is a spherical eye.
This understanding is incredibly valuable when considering a contact lens option for an irregular cornea. Mildly oblate corneas that are nearer to a spherical shape can often be fit with regular geometry lenses. However, highly oblate corneas are likely to require reverse geometry specialty lenses or vaulting scleral lens designs to manage the irregular shape of the eye.18
Figure 6 shows an example of one of these challenging cases. Notice the apparent lack of a corneal apex, with the flattest curvature located centrally and the steepest in the midperiphery. The scale range is 10.16D, which is above the irregularity threshold. Additionally, all of the disease detection indices are highlighted red, indicating that they are beyond the regular cornea range. It has been suggested that regular geometry lenses can be employed with e2 values less than –0.25.18 However, this cornea exhibits an extremely oblate shape, with an e2 value of –1.33. In corneal GP lenses, this tabletop-shaped eye would require an incredibly flat central base curve with a very steep midperiphery accompanied by flat peripheral curves.
Many of these diseased, post-surgical, and asymmetric eyes may require rigid lens optics to provide quality vision. A question that practitioners face is: “Do I fit a corneal or a scleral GP?” A topographer is very useful during this decision-making process. Figure 7 shows the same keratoconic cornea as in Figure 5, but using the elevation map rather than the axial map. With the elevation map, we can appreciate the heights and depressions of the corneal surface.1,21 The elevation map uses a reference surface that is meant to align with the apex of the cornea or within ±10 microns. The software calculates a best-fit sphere, which is the closest radius to the underlying cornea. Where the corneal tissue rises above the reference sphere, it appears as warm colors or red on the map and describes high surface elevation. Tissue that dips below the reference surface appears as cooler colors or blue and represents a depression or low elevation on the cornea. Therefore, red areas indicate where rigid contact lenses will land, and blue indicates where pooling should exist.
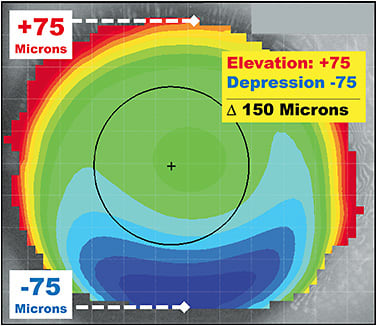
To determine whether a patient is a better candidate for a corneal or a scleral GP, find the meridian of greatest elevation change. Which meridian shows the deepest red-to-blue shift over a single axis of the eye? In Figure 7, the vertical meridian appears to have the most significant differential from red-to-blue. When clicking the cursor on the high point at 12 o’clock, the elevation measures +75 microns. When clicking at 6 o’clock, the lowest point of elevation is –75 microns. The absolute difference in height is 150 microns from the highest point to the lowest point along the same axis. Zheng and colleagues have shown that corneal GPs can be successful 88% of the time when the elevation differential is < 350 microns.22 However, when the asymmetry of the eye is high and the elevation differential is > 350 microns, a scleral lens may be necessary to achieve a successful fit. This rule, using the elevation map, can provide practitioners with a predictive direction when choosing a specialty contact lens option for a challenging corneal shape or condition.
EXAMPLE CASES
Case 1: The Kissing Doves A 69-year-old white male was referred by a cornea specialist for a specialty contact lens assessment. He had a history of pellucid marginal degeneration (PMD) OS > OD, was status post-transepithelial corneal cross-linking OD and OS, and was also pseudophakic. His best-corrected spectacle vision was 20/50-2 OD with +0.50 –7.00 x 085 and 20/70 OS with +2.50 –8.00 x 090. He was reluctant to wear contact lenses, as he had already attempted “those little shards of glass that kept popping out.” With PMD, corneal GP lenses typically decenter inferiorly toward the steepest curvature of the cornea. The topography maps in Figure 8 clearly show significant asymmetry between the superior and inferior aspects of each cornea. This is likely the cause of the contact lens instability to which the patient was alluding. The topographer used for this case has an analysis tool to determine corneal irregularity, and with this tool the scores were 95% OD and 84% OS for keratoconus. This tool does not differentiate keratoconus from PMD; that is left to the practitioner. There is a hint of the classic “kissing doves” or “crab claw” appearance of PMD in the axial and tangential maps, but it is important to look at the cornea as well for confirmation of PMD.
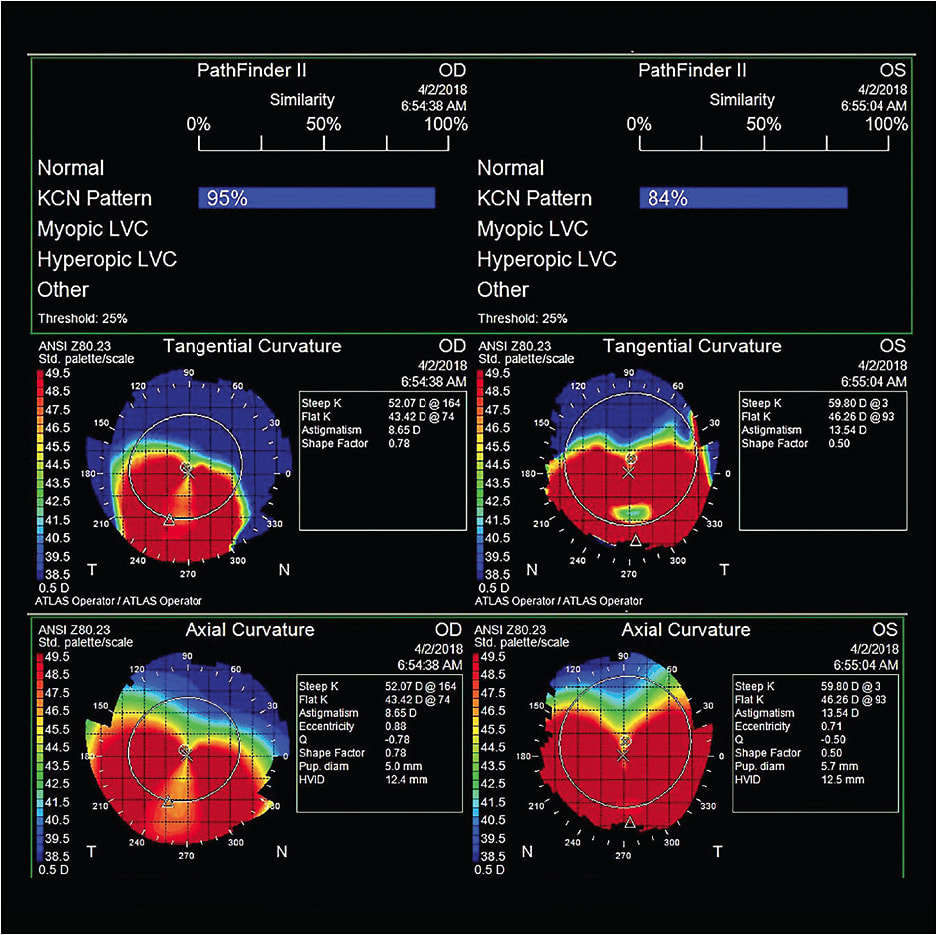
Figure 9 shows a more classic tangential map appearance of PMD, with the associated slit lamp image. Unlike keratoconus, in which the apex of ectasia is predominantly associated with the area of thinning, the apex is superior to the area of thinning in PMD, as shown by the arrows.
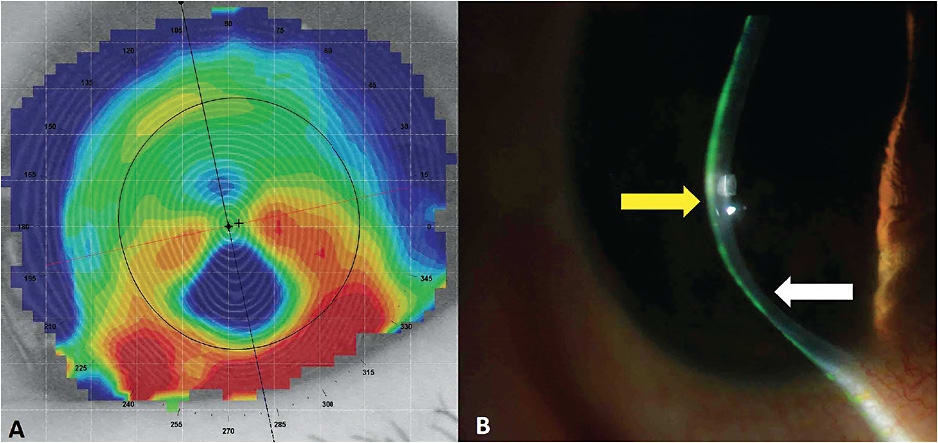
This patient demonstrated the same slit lamp appearance in each eye, with marginal thinning inferior to the ectatic steepening of the cornea, confirming his entering diagnosis of PMD. Despite his reluctance, he was willing to try the diagnostic scleral lenses in the office. His shape factor score from the topography was 0.78 OD and 0.50 OS, which both indicate a prolate shape. Prolate diagnostic scleral lenses with a 6.9mm base curve and 5,500-micron sagittal depth were applied, and his vision was over-refracted to 20/40 OD and 20/25+2 OS. He was ecstatic with the left eye, but he didn’t feel that there was an improvement in vision in the right eye compared to glasses, even though it was three lines better. An oblate trial lens was used with a base curve of 8.4mm and a sagittal depth of 5,400 microns that yielded a 20/20 visual outcome in the right eye. Even though his ectasia was significant and had more of a prolate profile, the flatter oblate base curve provided better vision for the right eye. He has been successfully wearing scleral lenses for two years and regrets not trying them sooner.
Scleral lenses are an excellent option for patients who have PMD. Unlike keratoconus, which is self-limiting, PMD may slowly continue to advance. This patient received cross-linking treatment and has been stable, but he is still closely monitored for progression. If his corneas do continue to progress, a benefit of scleral lenses is that they can continue to vault over the ectatic cornea and provide him with excellent functional vision.
Case 2: Under Pressure A 37-year-old white female who had a history of keratoconus OS > OD presented as a new patient complaining of discomfort and dryness in her current hybrid lenses. She noticed that her vision was getting worse with her contact lenses and glasses. Her entering contact lens acuity was OD 20/30, OS 20/40. The lenses were coated with debris, and her corneas presented with dense epithelial staining OS > OD. Her spectacle acuity was 20/20 OD with –6.75 –2.50 x 001 and 20/40 OS with –9.50 –3.50 x 140.
Due to the significant dryness and corneal staining, scleral lenses were advised for visual rehabilitation and for hydration of the corneal surface. The patient achieved visual acuity of 20/20 OD and 20/25+2 OS with scleral lenses, and the corneal staining resolved. Even though the scleral lenses vaulted over her corneas, topographies were monitored during the fitting process. The hybrid lens had been bearing on her left cornea. Fortunately, there was no scarring. Her cornea began to unmold under the scleral lens. Figure 10 shows a difference map comparing topographies between two different visits. If there is no change or difference between visits, the map will be a “sea of green.” However, Figure 10 shows a red “hot spot” in the difference map. This suggests that the cornea has steepened in that region since the last topography was captured. In this case, you might think that her keratoconus was progressing; but, in fact, it was just unmolding from the hybrid lens compressing the cone. Subsequent difference maps demonstrated no change. Ultimately, she was referred for cross-linking to prevent future progression.
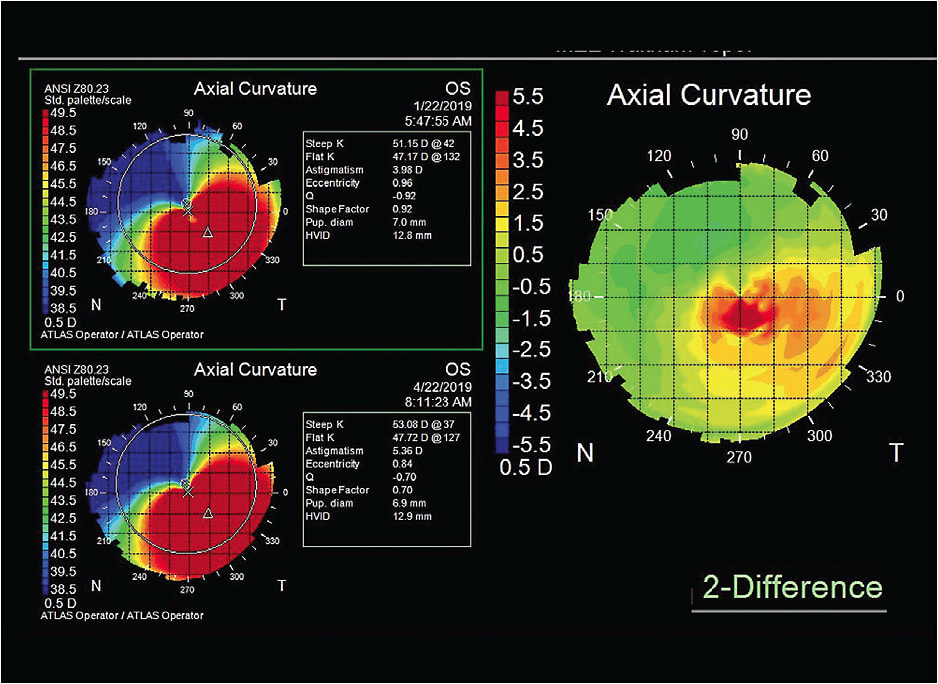
Difference maps are extremely important when monitoring ectasia patients. They can help determine whether there is progression of the ectasia and can support the need and urgency for cross-linking intervention.
IN CLOSING
Corneal topography is an essential tool in contact lens practice. We are increasingly moving into the digital age, in which artificial intelligence can help us to better and more quickly distinguish between normal and out-of-standard or irregular corneas. Practitioners should strive to use topography to its fullest capacity. Taking a good-quality image is essential, as is using different scales, indices, and maps. This can certainly help identify normal and non-normal eyes. Using elevation maps to determine the true shape of the eye is instrumental in contact lens practice, especially in choosing between corneal and scleral GP lenses. Apart from lens selection, topography can help monitor corneal changes during lens wear as well.
Corneal topography may be our most important tool in contact lens practice. Perhaps it is time for contact lens practitioners to position it more centrally in their practices, especially for cases in which the corneal apex is not positioned centrally. CLS
Acknowledgments: Special thanks to Jeroen Mulder and Sander Sterk for their valuable input in this article.
REFERENCES
- Van der Worp E. Orthokeratology: Shaping Up. Contact Lens Spectrum. 2008 Mar;23:28-33.
- Van der Worp E, de Brabander J, Jongsma F, Michaud L, Mulder JA. Corneal Topography. In Bennett E, Henry V. Clinical Manual of Contact Lenses. Fifth edition. Wolters Kluwer. 2020:58-95.
- Bardan AS, Kubrak-Kisza M, Kisza KJ, Nanavaty MA. Impact of classifying keratoconus location based on keratometry or pachymetry on progression parameters. Clin Exp Optom. 2020 May;103:312-319.
- Van der Worp E, Sterk S, Mulder J. Op Ooghoogte. Eyeline Journal (in Dutch). 2019 May:26-29.
- Hall LA, Hunt C, Young G, Wolffsohn J. Factors affecting corneoscleral topography. Invest Ophthalmol Vis Sci. 2013;54:3691-3701.
- Sulley A, Osborn Lorenz K, Wolffsohn JS, Young G. Theoretical fitting characteristics of typical soft contact lens designs. Cont Lens Anterior Eye. 2017 Aug;40:248-252.
- Mountford J, Ruston D, Dave T. Orthokeratology – Principles and Practice. Butterworth Heinemann. 2004; Chapter 2:17-47.
- Rabinowitz YS. Tangential vs sagittal videokeratographs in the “early” detection of keratoconus. Am J Ophthalmol. 1996 Dec;122:887-889.
- Maeda N, Klyce SD, Smolek MK. Comparison of methods for detecting keratoconus using videokeratography. Arch Ophthalmol. 1995 Jul;113:870-874.
- Gills JP, Sanders DR, Thornton SP, Martin RG. Corneal Topography: The State of the Art. Slack Incorporated. 1995 Mar:1-328.
- Hashemi H, Paksad R, Khabazhoob M, Yetka A, Emamian MH, Fotouhi A. Distribution of Different Corneal Topography Patterns in Iranian Schoolchildren: The Shahroud Schoolchildren Eye Cohort Study. Eye Contact Lens. 2020 May;46:154-159.
- Li X, Yang H, Rabinowitz YS. Keratoconus: classification scheme based on videokeratography and clinical signs. J Cataract Refract Surg. 2009 Sep;35:1597-1603.
- Maguire L, Klyce SD, McDonald MB, Kaufman HE. Corneal topography of pellucid marginal degeneration. Ophthalmology. 1987 May;94:519-524.
- Zadnik K, Barr JT, Edrington TB, et al. Baseline findings in the Collaborative Longitudinal Evaluation of Keratoconus (CLEK) Study. Invest Ophthalmol Vis Sci. 1998 Dec;39:2537-2546.
- Zhang YY, Jiang WJ, Teng ZE, et al. Corneal curvature radius and associated factors in Chinese children: the Shandong Children Eye Study. PLoS One. 2015 Feb 6;10:e0117481.
- Wilson SE, Lin DT, Klyce SD. Corneal topography of keratoconus. Cornea. 1991 Jan;10:2-8.
- Maeda N, Klyce SD, Smolek MK, Thompson HW. Automated keratoconus screening with corneal topography analysis. Invest Ophthalmol Vis Sci. 1994 May;35:2749-2757.
- Kojima R, Yee F. Fitting Challenge: Post-Surgical Corneas. Contact Lens Spectrum. 2009 Jan;24:40-43.
- Schanzlin DJ, Robin JB, eds. Corneal Topography: Measuring and Modifying the Cornea. Springer Science & Business Media. 2012:71-72.
- Swarbrick HA. The e’s, p’s and Q’s of corneal shape. Refractive Eyecare for Ophthalmologists. 2004;8(12):5-8.
- Gatinel D, Malet J, Hoang-Xuan T, Azar DT. Corneal elevation topography: best fit sphere, elevation distance, asphericity, toricity, and clinical implications. Cornea. 2011 May;30:508-515.
- Zheng F, Caroline P, Kojima R, Kinoshita B, André M, Lampa M. Corneal Elevation Differences and the Initial Selection of Corneal and Scleral Contact Lens. Poster presented at the Global Specialty Lens Symposium, 2015 Jan, Las Vegas.


