
THE OCULAR SURFACE provides the basis for ocular health and appropriate contact lens fitting. A healthy ocular surface is fundamental for optimal vision in a comfortable manner. New technologies are being developed to help practitioners understand the ocular surface and better care for patients. This feature will review advances in technologies that allow them to measure the ocular surface to help optimize patient outcomes.
DON’T FORGET ABOUT THE TRIED AND TRUE
In conversations pertaining to advanced ocular surface measurements, it’s often easy to overlook tools that are already in our offices. The slit lamp provides diagnostic information that sets the stage for appropriate therapy.
For instance, while viewing the lid margin at a low magnification, certain things may be overlooked. Viewing the same ocular structure at low and high magnification gives greater perspective on the ocular condition that may be causing the patient’s symptoms.
An example of this is assessing the base of the lashes at a patient’s lid margin. At a low magnification, the collarettes may seem insignificant. Viewing the same lid margin at a high magnification makes it easier to see the collarettes that are present (Figure 1).

Additionally, applying fluorescein dye to the ocular surface and viewing it with a cobalt blue light and a Wratten #12 filter reveals things about the ocular surface that are sometimes difficult to see with a standard slit lamp evaluation without fluorescein.
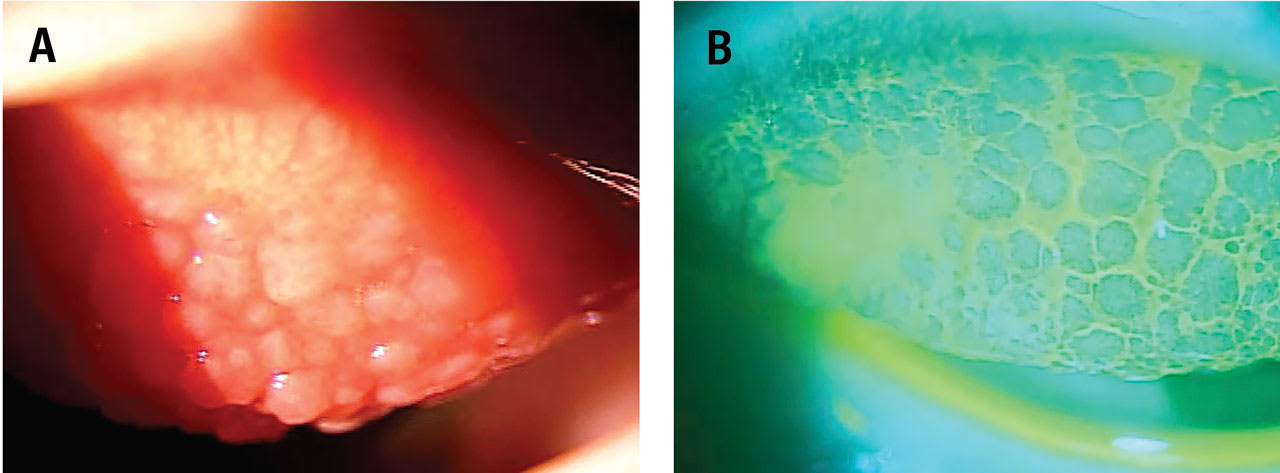
Where fluorescein pools, there will be hypofluorescence. Examples of this include conjunctival and corneal staining, accumulation of fluorescein around the base of papillae present on the palpebral conjunctival surface (Figure 2), and accumulation in regions of conjunctivochalasis, between folds of the conjunctiva.1 Fluorescein can also be observed in regions of the eye exposed to excessive friction, such as in the presence of lid wiper epitheliopathy.2

Lissamine green is another vital dye that shouldn’t be ignored. It stains dead or devitalized cells, allowing the visualization of ocular surface compromise.3 Lissamine green can be viewed with a standard white light slit lamp setting and low to moderate magnification. Anterior segment imaging should be considered if access to the technology is available to monitor progression of disease and response to therapy.
SAGITTAL DEPTH
Scleral lens fits are based on the sagittal depth of the lens. It is important that the lens sagittal depth corresponds to that needed for the ocular surface being fit. This can be accomplished in several ways. Diagnostic lenses can be applied to the ocular surface and then assessed at the slit lamp to estimate the clearance after the lens is settled.
Optical coherence tomography (OCT) is frequently utilized to measure the clearance of the lens over the cornea after the lens has been applied to the eye. Expected normal range for clearance is between 200µm and 400µm at the minimum clearance.4
Molded lenses are now being used for more advanced fittings. The surface of the eye is measured through impression molding, and the lens created from the mold and provides a highly customized lens.
Advanced technologies are now available to measure scleral topography, allowing customization of scleral lenses based on advanced measurements of the ocular surface. These technologies provide topography and elevation maps of the ocular surface, including both the cornea and sclera.5
Newer OCT technologies allow for larger horizontal cross-sectional scans of the cornea and anterior segment. It provides the ability to better select the initial diameter of a scleral lens based upon the horizontal visible iris diameter (HVID). Sagittal depth can be measured from the surface of the cornea to any chord length or width of the scan acquired.
A chord length of the diameter of a given lens can be used as a reference point for initial diagnostic lens selection. Once the chord length is determined and placed in the horizontal plane of the scan, measurements from the chord to the anterior surface of the cornea can be made to select the initial diagnostic lens, providing a more customized initial fitting experience. Typically, a sagittal depth 300µm to 400µm greater than the measured sagittal depth would be selected (Figures 3 and 4).


Not only is sagittal depth important in scleral lens fittings, but it also has a role in soft contact lens fitting. Increasing attention is being paid to the sagittal depth of soft lenses and the influence it has on a successful soft lens-wearing experience.6
The challenge is that, typically, soft lenses are labeled with the power, base curve, and diameter of the lens. They are not labeled with any sagittal depth measurements. One study has reported the sagittal depth on daily disposable and frequent replacement sphere and toric lenses, providing insights into the various sagittal depths of the different lens designs.6
TECHNOLOGY FOR LIMBAL CLEARANCE
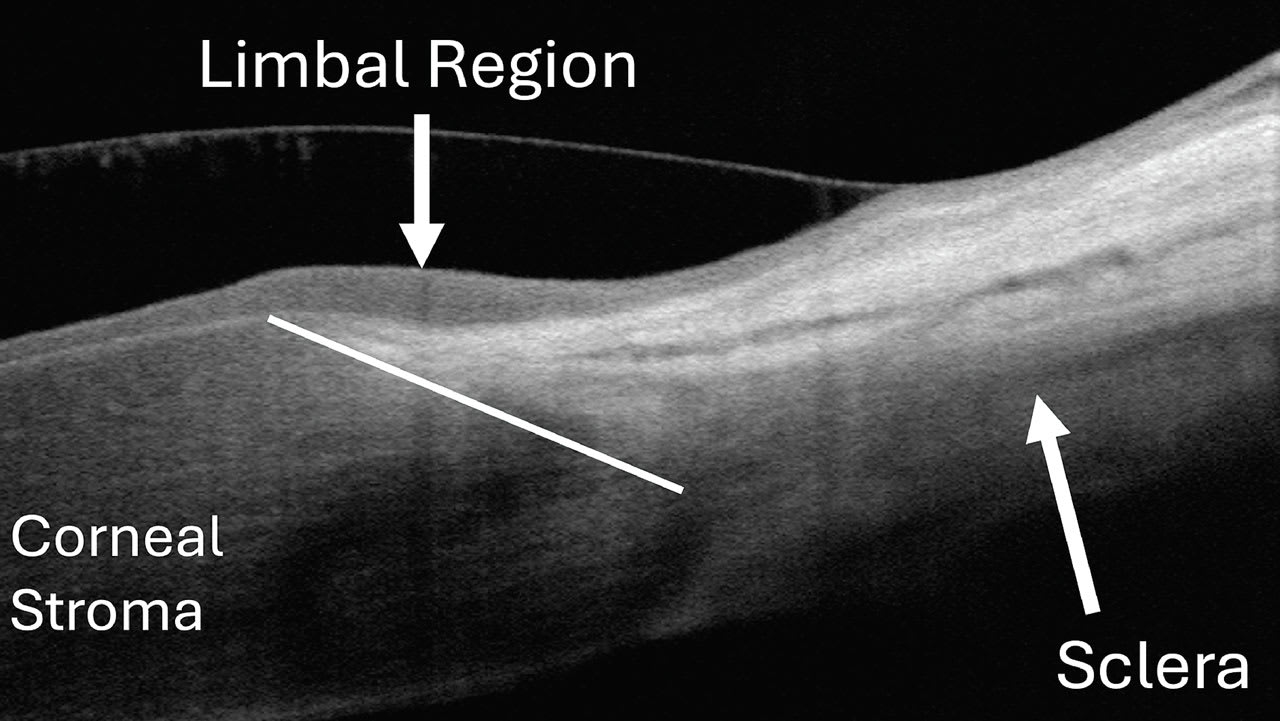
Limbal clearance is critical when fitting scleral lenses to avoid excessive pressure on the limbal stem cells. After the scleral lens is applied to the eye, OCT allows the practitioner to view the limbal region to assure clearance. On the OCT scan, there are several landmarks that help identify this region.
The first is the visible transition between the sclera and cornea, which resembles a triangular tissue. Additionally, a clear differentiation exists between the appearance of the corneal and conjunctival epithelium overlying the sclera. In some patients, there is also a visible thickening of the epithelium in the limbal region.7,8 Identifying these landmarks, and seeing the transitional epithelium between the two, helps identify the limbal region (Figure 5).

The goal for limbal clearance is between 100µm and 200µm.4 Between 50µm and 100µm is less than ideal but still acceptable. And, 200µm to 300µm is more than ideal but is still considered acceptable. Limbal clearance less than 50µm or greater than 300µm should be avoided.4 These criteria can be measured using OCT to ensure appropriate clearance.
Clinicians can be more proactive about selecting the diameter of scleral lenses by paying particular attention to the HVID. If one knows this measurement, along with the landing zone dimension, an appropriate lens diameter for the patient can be selected.
Further away from the limbal region, the sclera tends to become more irregular. Minimizing the diameter of the lens, while allowing enough room for adequate limbal clearance, may help clinicians select the lenses more efficiently. Fortunately, topography and OCT can be used to obtain HVID measurements prior to lens application, improving the efficiency and accuracy of the fitting.
EPITHELIAL THICKNESS MAPS
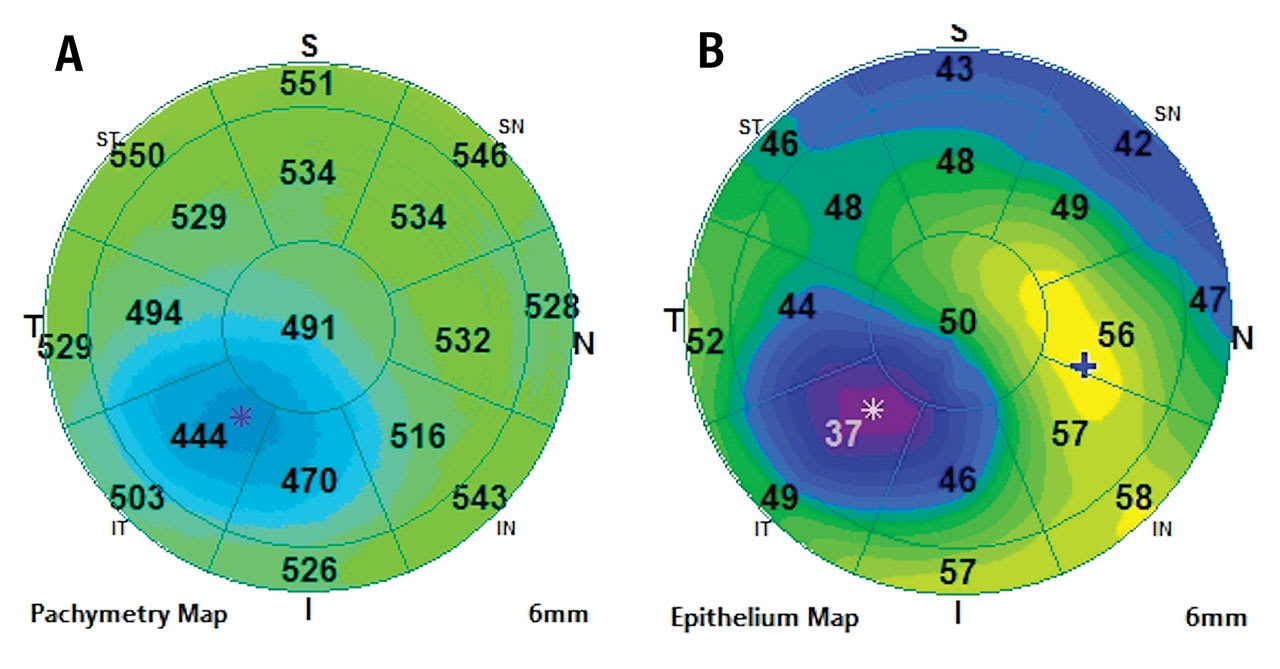
Epithelial thickness maps (ETMs) can be measured with OCT technology. Normal epithelial thickness (ET) is 54µm ± 5µm.9 It is typically thinner superiorly than inferiorly and thinner temporally than nasally.9 ETMs have utility in dry eye disease, refractive surgery pre- and postoperative care, epithelial basement membrane dystrophy (EBMD), keratoconus disease monitoring, and orthokeratology.
Dry Eye ET is a viable ocular surface marker to quantify dry eye over time.10 It’s been shown that ET in dry eye patients can detect highly irregular corneal thickness, with a higher level of corneal thickness variance compared to that seen in control patients.10 When dry eye patients were treated, corneal thickness irregularity and variance improved.10
Refractive Surgery ETMs may often provide insights into a patient’s visual acuity that standard topography and slit lamp evaluation may not. As discussed previously, ET is relatively consistent across the cornea. Post-refractive ET can vary tremendously.
At times, ET remains very consistent after refractive surgery. However, there are patients whose ET may not heal at a consistent thickness, resulting in irregularities in the thickness map, not only in the variance noted within the cornea, but also observed as an overall thickening of the ET. We have noted that this irregularity or overall thickening results in reduced best-corrected visual acuity that is often improved with a specialty lens fitting.
EBMD This condition results from aberrant attachment of basal epithelial cells of the cornea to the underlying basement membrane. This is caused by the basement membrane extending anteriorly into the epithelium, elevating the total cornea in that region but ultimately reducing the thickness of the epithelium. This results in greater variance in ET.11
Keratoconus This condition is a progressive corneal thinning that results in an ectasia of the cornea. The stroma thins early in the disease and continues to thin as the disease progresses. The ET will also thin in patients who have keratoconus as the condition progresses. ET is becoming an increasingly important measurement to identify and follow keratoconus12,13 (Figure 6).

Orthokeratology This procedure produces differential pressure along the surface of the cornea, which will create differential ET. Ideally the treatment zone will be well centered on the cornea with an area of central epithelial thinning.14,15 In addition to topography and slit lamp evaluation, this measurement can help optimize orthokeratology outcomes.
MOLECULAR OCULAR SURFACE MEASUREMENTS
Tear film measurements continue to be increasingly sophisticated. These metrics provide a picture of the health of the tear film. There are several point-of-care tests that are currently available, and others that are continuing to be developed to provide more information about the integrity of the tear film and ocular surface.
Tear film osmolarity can be metricized using a device that provides clinicians with an accurate osmolarity reading within minutes based on a small sample of tears from each eye. The average tear osmolarity for normal subjects is 303.2 ± 7.0, compared to 322.7 ± 15.9 in subjects with keratoconjunctivitis sicca.16 Dry eye patients tend to have higher levels of osmolarity.16 Diagnostically, large differences in osmolarity levels between the two eyes can also indicate dry eye.
Matrix metalloproteinase-9 (MMP-9) levels can also be measured on the ocular surface through a point-of-care test. A small sample of tears from each eye is acquired, and, through an antibody-antigen reaction in the test well of the instrument, the clinician gains information about the level of MMP-9.17
MMP-9 is a nonspecific inflammatory marker that is elevated in inflammatory ocular conditions. It is typically used for dry eye and helps guide clinical decisions regarding treatment for patients. Normal MMP-9 levels are below 40ng/ml in the tear sample.18 Levels above this are abnormal and indicate a positive test response.
More recently, a newer testing platform has become available to measure additional molecules in the tear film. It provides objective measures of two key molecules found in the tear film: lactoferrin and immunoglobin E (IgE).19 This will help clinicians make the best therapeutic decisions to preserve the health of the ocular surface.
Lactoferrin is an enzyme that occurs naturally in the tear film and helps defend the ocular surface from pathogens. In patients who have dry eye, it is present at a reduced concentration in the tear film.20 This may be a clinical marker that can help them identify patients whose aqueous production is low and provide practitioners with a level to monitor over time to determine the efficacy of dry eye treatment.
IgE molecules are found on mast cells that are sensitized to certain allergens. When allergens are present in the environment, they cause cross-linking of the IgE molecules, triggering histamine release from the mast cells. This leads to the classic allergic conjunctivitis response consisting of itching, conjunctival hyperemia, chemosis, eyelid swelling, and watering.
Additionally, during active allergic disease, IgE is found to be elevated in the tear film as well.21 Normal levels of IgE in the tear film are expected to be less than 80ng/mL. Levels above this threshold are indicative of an allergic response.19
AI’S IMPACT ON OCULAR SURFACE MEASUREMENTS
Although artificial intelligence (AI) has been evolving for decades, most practitioners are just now starting to imagine its impact on their daily lives and, hopefully, its impact on patients. AI is poised to play a meaningful role in ocular surface measurement.
As was highlighted recently by the co-author, AI has some limitations with regard to dry eye disease.22 It excels at taking large databases and finding links and unity in the data. Many eyecare providers struggle with the unity of the definition of dry eye, how to classify it, and, ultimately, how to diagnose and treat it.
Although studies gather an overwhelming amount of data for ocular surface patients, the treatments in studies tend to be singular and lack variability when a patient has multiple comorbidities contributing to their ocular surface disease. AI lacks the consistency in data management across large-scale algorithms to be able to develop a cohesive treatment algorithm to come up with its own treatment suggestions based on positive outcomes.
A fascinating discussion of how practitioners are implementing wearable devices to measure nutrient and chemical components in the body and the eyes was published by Yu and colleagues.23 While one might anticipate this type of data gradually becoming available to clinics over time, the wealth of knowledge that we may be gaining about the tear film and can be entered into AI is exciting.
As these devices are initially rolled out into research studies, practitioners see that the devices will provide them with a greater understanding of the type of dry eye that patients have and give quantifiable numbers related to the tear film, its stability, and what we might expect from patients who present with various types of complaints or ocular issues.
For example, a patient who presents with an insufficiency of one nutrient, or a particular marker of inflammation, may present clinically with a certain pattern of staining or a high correlation to elevated osmolarity. Once the ocular surface issue is identified, technology will be better able to target therapies that most closely match up to the dysregulation or alteration of the tear film.
CONCLUSION
Next-generation technologies that provide ocular surface measurements are helping us take better care of our patients. Embracing these advances will help us understand the ocular surface better and create more customized treatment plans.
REFERENCES
1. Marmalidou A, Kheirkhah A, Dana R. Conjunctivochalasis: a systematic review. Surv Ophthalmol. 2018 Jul-Aug;63:554-564.
2. Korb DR, Herman JP, Greiner JV, et al. Lid wiper epitheliopathy and dry eye symptoms. Eye Contact Lens. 2005 Jan;31:2-8.
3. Zeev MS-B, Miller DD, Latkany R. Diagnosis of dry eye disease and emerging technologies. Clin Ophthalmol. 2014 Mar 20:8:581-590.
4. Kumar P, Carrasquillo KG, Chaudhary S, Basu S. A multi-parameter grading system for optimal fitting of scleral contact lenses. Version 2. F1000Res. 2022 Jan;11:6.
5. Batailleand L, Piñero DP. Characterization of the geometric properties of the sclero-conjunctival structure: a review. Int J Ophthalmol. 2020 Sep 18;13:1484-1492.
6. Worp Evd, Lampa M, Kinoshita M, Fujimoto MJ, Coldrick BJ, Caroline P. Variation in sag values in daily disposable, reusable and toric soft contact lenses. Cont Lens Anterior Eye. 2021 Dec;44:101386.
7. Chen YY, Sun YC, Tsai CY, et al. Spectral-domain optical coherence tomography for evaluating palisades of Vogt in ocular surface disorders with limbal involvement. Sci Rep. 2021 Jun 14;11:12502
8. Yang Y, Hong J, Deng SX, Xu J. Age-related changes in human corneal epithelial thickness measured with anterior segment optical coherence tomography. Invest Ophthalmol Vis Sci. 2014 Jul 22;55:5032-5038.
9. Vanathi M. Corneal epithelial thickness mapping. Indian J Ophthalmol. 2024 Feb 1;72:155-156.
10. Shousha MA, Wang J, Kontadakis G, et al. Corneal epithelial thickness profile in dry-eye disease. Eye (Lond). 2020 May;34:915-922.
11. Buffault J, Zeboulon P, Liang H, et al. Assessment of corneal epithelial thickness mapping in epithelial basement membrane dystrophy. PLoS One. 2020 Nov 25;15:e0239124.
12. Alghamdi A, Khan MS, Dakhil, TA. Understanding Corneal Epithelial Thickness Mapping. Middle East Afr J Ophthalmol. 2023 May 25;29:147-155.
13. Yang Y, Pavlatos E, Chamberlain W, Huang D, Li Y. Keratoconus detection using OCT corneal and epithelial thickness map parameters and patterns. J Cataract Refract Surg. 2021 Jun 1;47:759-766.
14. Kuo Y-K, Chen Y-T, Chen H-M, et al. Efficacy of Myopia Control and Distribution of Corneal Epithelial Thickness in Children Treated with Orthokeratology Assessed Using Optical Coherence Tomography. J Pers Med. 2022 Feb 14;12:278.
15. Kim WK, Kim JB, Ryu I-H, Kim JK, Kim SW. Corneal epithelial and stromal thickness changes in myopic orthokeratology and their relationship with refractive change. PLoS One. 2018 Sep 25;13:e0203652.
16. Fagehi R. Development in Tear Film Osmolarity Assessments: A Review. Nepal J Ophthalmol. 2021 Jan;13:122-132.
17. Sambursky R, Davitt WF 3rd, Friedberg M, Tauber S. Prospective, multicenter, clinical evaluation of point-of-care matrix metalloproteinase-9 test for confirming dry eye disease. Cornea. 2014 Aug;33:812-818.
18. Sambursky R. Presence or absence of ocular surface inflammation directs clinical and therapeutic management of dry eye. Clin Ophthalmol. 2016 Nov 24;10:2337-2343.
19. Verséa Ophthalmics T-POC IgE Test Package Insert. Available at versea.com/wp-content/uploads/2023/07/6d542919-3b12-43c3-8016-be6bf890c2c1-TICKET.hs_file_upload-AP0053.0-IFU-Insert_IgE_FINAL-062123-APPROVED.pdf. Accessed 2024 Jul 2.
20. Ohashi Y, Ishida R, Kojima T, et al. Abnormal protein profiles in tears with dry eye syndrome. Am J Ophthalmol. 2003 Aug;136:291-299.
21. Mimura T, Yamagami S, Kamei Y, Goto M, Matsubara M. Specific IgE in tear fluid and features of allergic conjunctivitis. Curr Eye Res. 2013 Sep;38:917-925.
22. Kading D. AI’s Frustration with the Dry Eye Space. Contact Lens Spectrum. 2024 July/Aug;39:36. Available at clspectrum.com/issues/2024/julyaugust/ai-in-practice. Accessed 2024 Jul 26.
23. Yu L, Yang Z, An M. Lab on the eye: A review of tear-based wearable devices for medical use and health management. Biosci Trends. 2019;13:308-313.


